
As business analysts, we are very keen on making sure that our stakeholders understand the information flow that happens within the organization across the application.
Is there a technique that can help us with that?
Of course, there is. For example, this blog talks about the same technique called data flow. Somehow, this technique is not used by many BAs nowadays. But to me, it is fantastic because it gives stakeholders a very clear idea of how the data comes, how it is stored, how it is used, and especially with the increased emphasis on data and data analysis, DFDS is going to be exceptionally helpful.
Data Flow Diagrams (DFDs) show the transformation of data from (data sources such as external sources, activities, and destinations). Data elements used in DFDs should be shown in the data dictionary. The data dictionary should have The highest level data flow diagram, also called the Level 0 diagram, which is known as the context diagram. The context diagram represents the entire system. check out the cbap training article here.
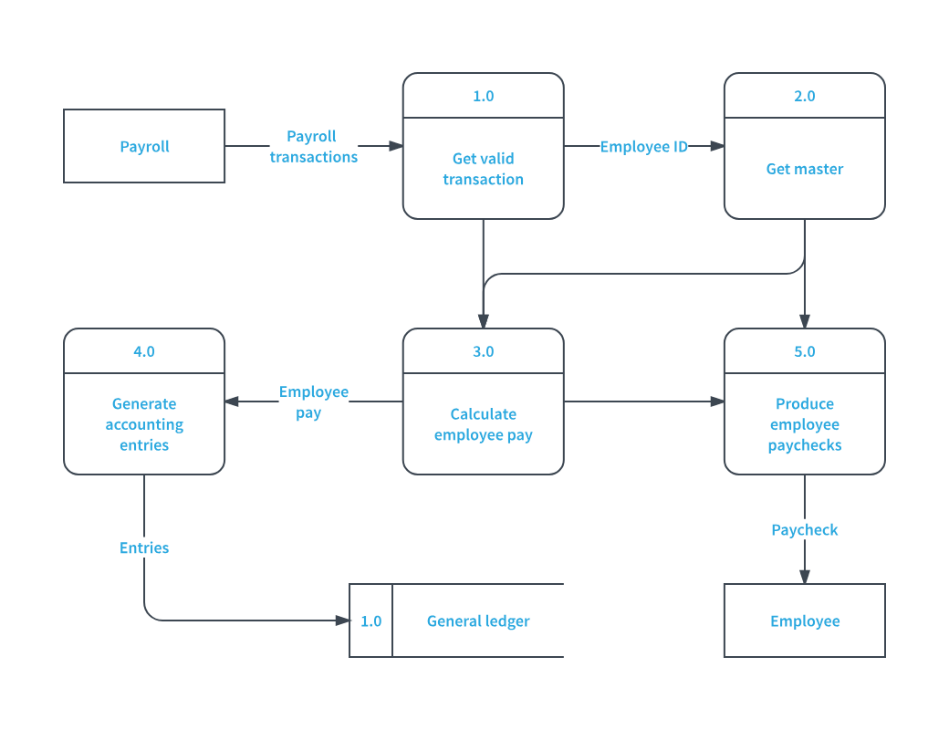
Context Diagram Gane-Sarson Notation
Level 1 DFDs show processes related to the system with respective input data, output transformed data, and data stores.
Further levels (levels 2 and 3) break down major processes from the level 1 diagram.
Logical data flow diagrams represent the future or essential state. Physical data flow diagrams model all data stores, printers, forms, devices, and other manifestations of current or future state data.
Externals such as Entity (Source, or Sink, or both) - Person, system, organization, or device providing or receiving data. These are outside of the system under analysis. Each external must have at least one data flow going to or coming from it. They are represented by a noun inside a rectangle.
Datastore
Stores data for future use. Must have at least one data flow going to or coming from it. They are represented as two parallel lines or as an open-ended rectangle consisting of a label.
Process
It transforms data into an output. The names contain a noun and a verb. It must have at least one data flow leading to it and one data flow coming from it. It is shown as a circle or rectangle with rounded corners.
Data flow
The movement of data between an external, a process, and a data store. It is represented as a line with an arrow displayed between processes. These are named using nouns.
Strengths
·Shows transaction-based systems and boundaries of a system.
· Discovers data and processes.
· Incredible way to define the scope and interfaces.
· Helps in effort estimation.
· Easily understandable.
· Helps in identifying duplicate or missing data elements.
Limitations
· Can become complex for large-scale systems.
· Different DFD notations exist.
· Can't show the sequence of logical activities or stakeholders.
Worked out Example:
Let us learn the data flow diagram through an example. The governance, Risk, and Compliance (GRC) management system is developed for the IT and ITES domain. The main motive of the GRC management system is to help organizations implement Governance, Quality, and Information Security Management Systems in an integrated manner. Among various its features, one of them is to plan and track projects and programs using standards such as CMMI, ISO 9001, ISO 27001, etc.
Let's use this example to show you how data flows and its transformation in the Project Schedule Management module of Governance Risk and Compliance Management.
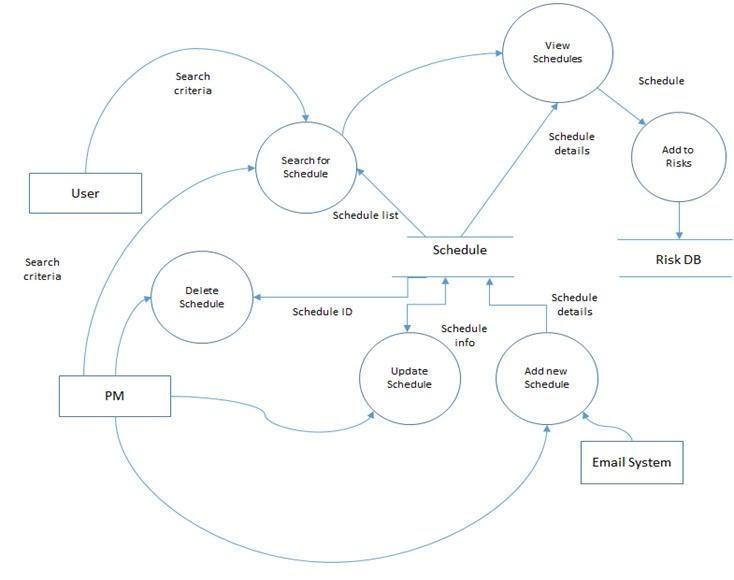
An external entity is a person, organization, automated system, or any
device capable of producing or receiving data. It can be a source of information (source) or sink (receiver of information). The user shown in the diagram is a source as the user has to provide the search criteria. Another source is the PM. These are depicted using rectangles.
Search for a schedule, delete a schedule, add a new one, update it, etc., are data processes. Here, the data is transformed into an output. For instance, the add new schedule process provides schedule details as to its output. It is depicted in the form of a circle or a rectangle with rounded corners. Processes must have at least one input and one output.
Schedule and Risk DB are data stores. The schedule datastore is a collection of data related to schedules where data may be read repeatedly and stored for further use. Each datastore must have at least one data flow going to it or coming from it. It is shown as two parallel lines or as an open-ended rectangle.
Thus, data flow diagrams show how data is transformed. It shows the source of the data, the processing activities, and whether the output results can be stored or used by another activity. DFDs are relatively easy to understand and a great way of illustrating interfaces, connections to other systems, etc. However, it doesn't illustrate the sequence of activities and can become increasingly complex for large-scale systems.
About Adaptive US
Adaptive US is the World's #1 Provider of IIBA Certifications Courses and Study Aids on CBAP, CCBA, ECBA, CBDA, CPOA, AAC, and CCA. It is the ONLY training institute that offers a 100% Success Guarantee or 100% Refund promise for all IIBA certifications Instructor-Led Training. It also provides skill-based training to business analyst on business analysis tools and templates.


